#使用以下命令查看docker原生的三种网络 [root@localhost ~]# docker network ls NETWORK ID NAME DRIVER SCOPE 0efec019c899 bridge bridge local 40add8bb5f07 host host local ad94f0b1cca6 none null local
#none网络,在该网络下的容器仅有lo网卡,属于封闭式网络,通常用于对安全性要求较高并且不需要联网的应用 [root@localhost ~]# docker run -it --network=none busybox / # ifconfig lo Link encap:Local Loopback inet addr:127.0.0.1 Mask:255.0.0.0 UP LOOPBACK RUNNING MTU:65536 Metric:1 RX packets:0 errors:0 dropped:0 overruns:0 frame:0 TX packets:0 errors:0 dropped:0 overruns:0 carrier:0 collisions:0 txqueuelen:1000 RX bytes:0 (0.0 B) TX bytes:0 (0.0 B)
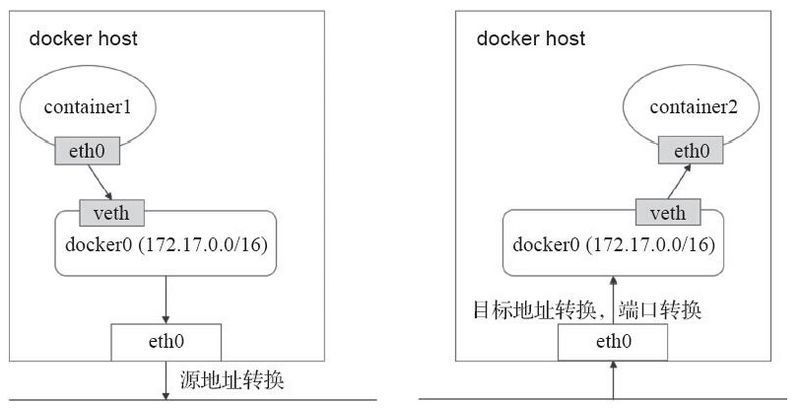
#bridge网络,Docker安装完成时会创建一个名为docker0的linux bridge,不指定网络时,创建的网络默认为桥接网络,都会桥接到docker0上。 [root@localhost ~]# brctl show bridge name bridge id STP enabled interfaces docker0 8000.024229098fdd no
[root@localhost ~]# docker run -d nginx #运行一个nginx容器 c760a1b6c9891c02c992972d10a99639d4816c4160d633f1c5076292855bbf2b
[root@localhost ~]# brctl show bridge name bridge id STP enabled interfaces docker0 8000.024229098fdd no veth3f1b114
#一个新的网络接口veth3f1b114桥接到了docker0上,veth3f1b114就是新创建的容器的虚拟网卡。进入容器查看其网络配置: [root@localhost ~]# docker exec -it c760a1b6c98 bash root@c760a1b6c989:/# apt-get update root@c760a1b6c989:/# apt-get iproute root@c760a1b6c989:/# ip a 1: lo: <LOOPBACK,UP,LOWER_UP> mtu 65536 qdisc noqueue state UNKNOWN group default qlen 1000 link/loopback 00:00:00:00:00:00 brd 00:00:00:00:00:00 inet 127.0.0.1/8 scope host lo valid_lft forever preferred_lft forever 38: eth0@if39: <BROADCAST,MULTICAST,UP,LOWER_UP> mtu 1500 qdisc noqueue state UP group default link/ether 02:42:ac:11:00:02 brd ff:ff:ff:ff:ff:ff link-netnsid 0 inet 172.17.0.2/16 brd 172.17.255.255 scope global eth0 valid_lft forever preferred_lft forever
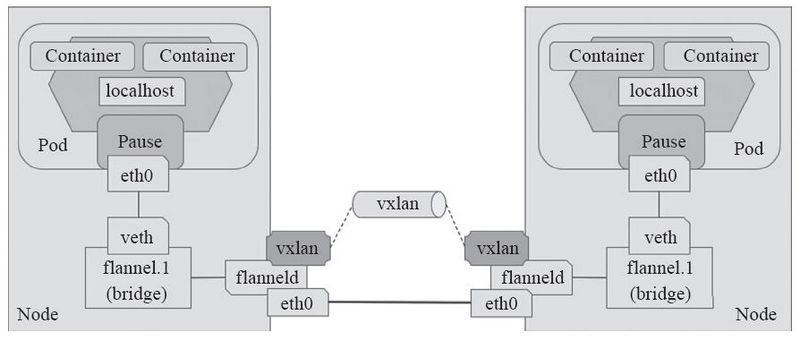
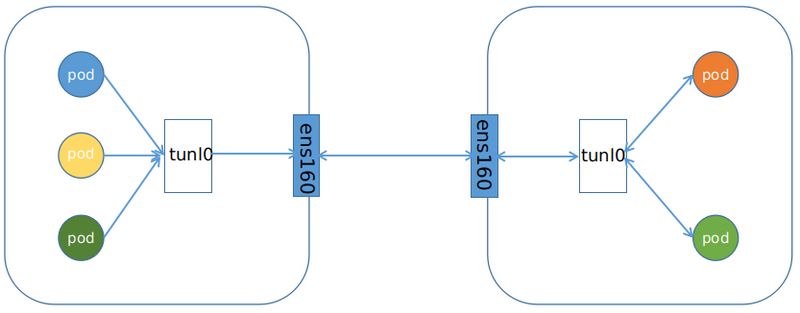
VxLAN(Virtual extensible Local Area Network)虚拟可扩展局域网,采用MAC in UDP封装方式,具体的实现方式为:
1、将虚拟网络的数据帧添加到VxLAN首部,封装在物理网络的UDP报文中
2、以传统网络的通信方式传送该UDP报文
3、到达目的主机后,去掉物理网络报文的头部信息以及VxLAN首部,并交付给目的终端
跨节点的Pod之间的通信就是以上的一个过程,整个过程中通信双方对物理网络是没有感知的。如下网络图:
VxLAN的部署可以直接在官方上找到其YAML文件,如下:
1
2
3
4
5
6
7
8
9
10
11
12
13
14
15
16
[root@k8s-master:~# kubectl apply -f https://raw.githubusercontent.com/coreos/flannel/bc79dd1505b0c8681ece4de4c0d86c5cd2643275/Documentation/kube-flannel.yml
clusterrole.rbac.authorization.k8s.io/flannel created
clusterrolebinding.rbac.authorization.k8s.io/flannel created
serviceaccount/flannel created
configmap/kube-flannel-cfg created
daemonset.extensions/kube-flannel-ds-amd64 created
daemonset.extensions/kube-flannel-ds-arm64 created
daemonset.extensions/kube-flannel-ds-arm created
daemonset.extensions/kube-flannel-ds-ppc64le created
daemonset.extensions/kube-flannel-ds-s390x created

#输出如下结果表示flannel可以正常运行了
[root@k8s-master ~]# kubectl get daemonset -n kube-system
NAME              DESIRED   CURRENT   READY     UP-TO-DATE   AVAILABLE   NODE SELECTOR                   AGE
kube-flannel-ds   3         3         3         3            3           beta.kubernetes.io/arch=amd64   202d
kube-proxy        3         3         3         3            3           beta.kubernetes.io/arch=amd64   202d
[root@k8s-master ~]# kubectl get node NAME STATUS ROLES AGE VERSION k8s-master Ready master 202d v1.11.2 k8s-node01 Ready <none> 202d v1.11.2 k8s-node02 Ready <none> 201d v1.11.2
[root@k8s-master ~]# kubectl apply -f kube-flannel.yml clusterrole.rbac.authorization.k8s.io/flannel configured clusterrolebinding.rbac.authorization.k8s.io/flannel configured serviceaccount/flannel unchanged configmap/kube-flannel-cfg configured daemonset.extensions/kube-flannel-ds-amd64 created daemonset.extensions/kube-flannel-ds-arm64 created daemonset.extensions/kube-flannel-ds-arm created daemonset.extensions/kube-flannel-ds-ppc64le created daemonset.extensions/kube-flannel-ds-s390x created
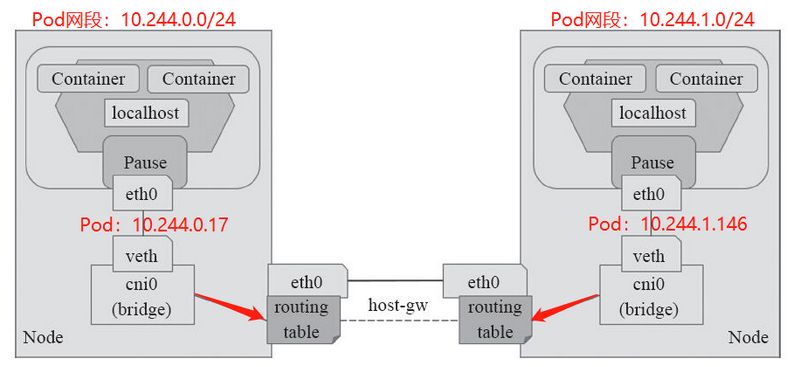
#查看路由信息 [root@k8s-master ~]# ip route ...... 10.244.1.0/24 via 192.168.56.12 dev eth0 10.244.2.0/24 via 192.168.56.13 dev eth0 ......
#查看路由表信息,可以看到其报文的发送方向都是和Directrouting是一样的 [root@k8s-master ~]# ip route ...... 10.244.1.0/24 via 192.168.56.12 dev eth0 10.244.2.0/24 via 192.168.56.13 dev eth0 .....
从字面来理解,就是把一个IP数据包又套在一个IP包里,即把 IP 层封装到 IP 层的一个 tunnel。它的作用其实基本上就相当于一个基于IP层的网桥!一般来说,普通的网桥是基于mac层的,根本不需 IP,而这个 ipip 则是通过两端的路由做一个 tunnel,把两个本来不通的网络通过点对点连接起来。
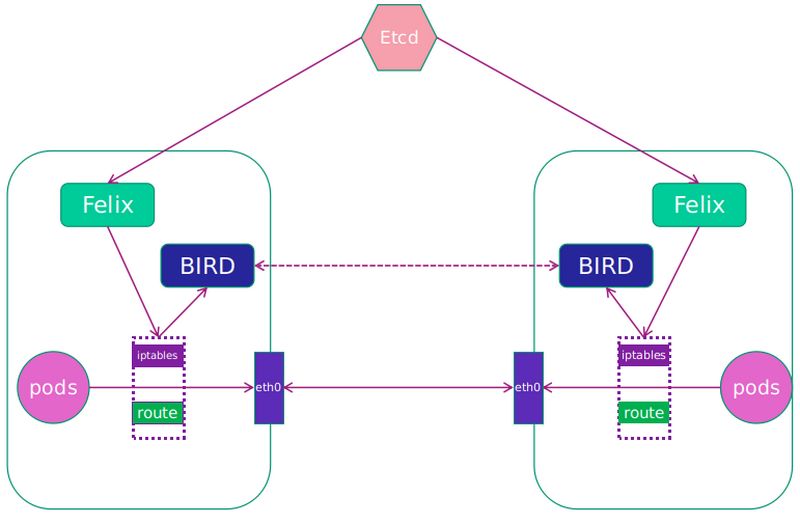
# 查看BGP建立的邻接关系状态 [root@k8s-master src]# calicoctl node status Calico process is running.
IPv4 BGP status +--------------+-------------------+-------+------------+-------------+ | PEER ADDRESS | PEER TYPE | STATE | SINCE | INFO | +--------------+-------------------+-------+------------+-------------+ | 192.168.1.42 | node-to-node mesh | up | 2020-07-24 | Established | | 192.168.1.43 | node-to-node mesh | up | 2020-07-24 | Established | +--------------+-------------------+-------+------------+-------------+
# 查看邻接信息 [root@k8s-master calico]# calicoctl node status Calico process is running. IPv4 BGP status No IPv4 peers found. IPv6 BGP status No IPv6 peers found.
# 查看bgppeer [root@k8s-master calico]# calicoctl get bgppeer NAME PEERIP NODE ASN peer-with-route-reflectors all() 0
# 查看节点邻接状态(Master和两个节点建立连接,两个Node只和master建立连接) [root@k8s-master calico]# calicoctl node status Calico process is running. IPv4 BGP status +--------------+---------------+-------+----------+-------------+ | PEER ADDRESS | PEER TYPE | STATE | SINCE | INFO | +--------------+---------------+-------+----------+-------------+ | 192.168.1.42 | node specific | up | 05:44:18 | Established | | 192.168.1.43 | node specific | up | 05:44:18 | Established | +--------------+---------------+-------+----------+-------------+ [root@k8s-node02 ~]# calicoctl node status Calico process is running. IPv4 BGP status +--------------+---------------+-------+----------+-------------+ | PEER ADDRESS | PEER TYPE | STATE | SINCE | INFO | +--------------+---------------+-------+----------+-------------+ | 192.168.1.41 | node specific | up | 05:44:19 | Established | +--------------+---------------+-------+----------+-------------+ [root@k8s-node01 kubernetes]# calicoctl node status Calico process is running. IPv4 BGP status +--------------+---------------+-------+----------+-------------+ | PEER ADDRESS | PEER TYPE | STATE | SINCE | INFO | +--------------+---------------+-------+----------+-------------+ | 192.168.1.41 | node specific | up | 05:44:19 | Established | +--------------+---------------+-------+----------+-------------+
# ping一个Pod的IP地址验证,发现网络通了。 [root@k8s-master calico]# ping 10.244.214.14 PING 10.244.214.14 (10.244.214.14) 56(84) bytes of data. 64 bytes from 10.244.214.14: icmp_seq=1 ttl=63 time=1.63 ms 64 bytes from 10.244.214.14: icmp_seq=2 ttl=63 time=0.378 ms
# 查看节点邻接状态(两个RR之间 master节点和node01节点互相建立连接,node02节点分别会和master和node01节点建立连接) [root@k8s-master calico]# calicoctl node status IPv4 BGP status +--------------+---------------+-------+----------+-------------+ | PEER ADDRESS | PEER TYPE | STATE | SINCE | INFO | +--------------+---------------+-------+----------+-------------+ | 192.168.1.43 | node specific | up | 05:44:18 | Established | | 192.168.1.42 | node specific | up | 07:01:21 | Established | +--------------+---------------+-------+----------+-------------+ [root@k8s-node01 kubernetes]# calicoctl node status IPv4 BGP status +--------------+---------------+-------+----------+-------------+ | PEER ADDRESS | PEER TYPE | STATE | SINCE | INFO | +--------------+---------------+-------+----------+-------------+ | 192.168.1.41 | node specific | up | 07:01:21 | Established | | 192.168.1.43 | node specific | up | 07:03:05 | Established | +--------------+---------------+-------+----------+-------------+ [root@k8s-node02 ~]# calicoctl node status IPv4 BGP status +--------------+---------------+-------+----------+-------------+ | PEER ADDRESS | PEER TYPE | STATE | SINCE | INFO | +--------------+---------------+-------+----------+-------------+ | 192.168.1.41 | node specific | up | 05:44:20 | Established | | 192.168.1.42 | node specific | up | 07:03:07 | Established | +--------------+---------------+-------+----------+-------------+
[root@k8s-master src]# calicoctl node status Calico process is running.
IPv4 BGP status +--------------+-------------------+-------+------------+-------------+ | PEER ADDRESS | PEER TYPE | STATE | SINCE | INFO | +--------------+-------------------+-------+------------+-------------+ | 192.168.1.42 | node-to-node mesh | up | 2020-07-24 | Established | | 192.168.1.43 | node-to-node mesh | up | 2020-07-24 | Established | +--------------+-------------------+-------+------------+-------------+
查看所有Node节点
1
2
3
4
5
[root@k8s-master /]# calicoctl get node NAME k8s-master.nnv5.cn k8s-node01.nnv5.cn k8s-node02.nnv5.cn
查看calico分配的网络地址段
1 2 3
[root@k8s-master /]# calicoctl get ippool NAME CIDR SELECTOR default-ipv4-ippool 10.244.0.0/16 all()
11.5 Kubernetes网络策略
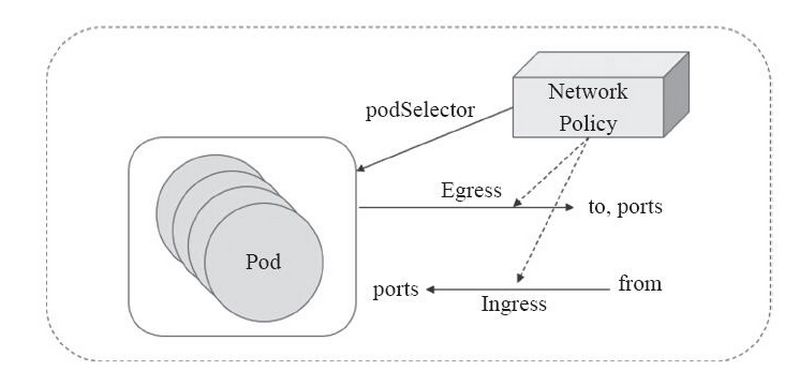
网络策略(Network Policy )是 Kubernetes 的一种资源。Network Policy 通过 Label 选择 Pod,并指定其他 Pod 或外界如何与这些 Pod 通信。
Pod的网络流量包含流入(Ingress)和流出(Egress)两种方向。默认情况下,所有 Pod 是非隔离的,即任何来源的网络流量都能够访问 Pod,没有任何限制。当为 Pod 定义了 Network Policy,只有 Policy 允许的流量才能访问 Pod。
[root@k8s-master network-policy-demo]# kubectl get svc httpd-svc NAME TYPE CLUSTER-IP EXTERNAL-IP PORT(S) AGE httpd-svc NodePort 10.99.222.179 <none> 8080:30000/TCP 4m
[root@k8s-master network-policy-demo]# kubectl apply -f policy-demo.yaml networkpolicy.networking.k8s.io/deny-all-ingress created [root@k8s-master network-policy-demo]# kubectl get networkpolicy NAME POD-SELECTOR AGE deny-all-ingress <none> 11s
#此时再去访问测试,是无法ping通,无法访问的 [root@k8s-master ~]# kubectl run busybox --rm -it --image=busybox /bin/sh If you don't see a command prompt, try pressing enter. / # wget httpd-svc:8080 Connecting to httpd-svc:8080 (10.99.222.179:8080) wget: can't connect to remote host (10.99.222.179): Connection timed out
[root@k8s-master network-policy-demo]# kubectl apply -f policy-demo.yaml networkpolicy.networking.k8s.io/access-httpd created [root@k8s-master network-policy-demo]# kubectl get networkpolicy NAME POD-SELECTOR AGE access-httpd run=httpd 6s
验证NetworkPolicy的有效性:
1 2 3 4 5 6 7 8 9 10 11
#创建带有标签的busybox pod访问,是可以正常访问的,但是因为仅开放了TCP协议,所以PING是无法ping通的
[root@k8s-master ~]# kubectl run busybox --rm -it --labels="access=true" --image=busybox /bin/sh
If you don't see a command prompt, try pressing enter.
/ # wget httpd-svc:8080
Connecting to httpd-svc:8080 (10.99.222.179:8080)
index.html           100% |*********************************************************************************************|    45  0:00:00 ETA
/ # ping -c 3 10.244.0.2
PING 10.244.0.2 (10.244.0.2): 56 data bytes

--- 10.244.0.2 ping statistics ---
3 packets transmitted, 0 packets received, 100% packet loss